How to use the Rectangular Price Boxes Strategy

The ability to identify support and resistance is the foundation of the rectangular pricing pattern. It can give you consistent results in a short period of time. This guide will teach you how to spot the pattern and how to use it effectively when trading.

How do I spot a rectangular price pattern?

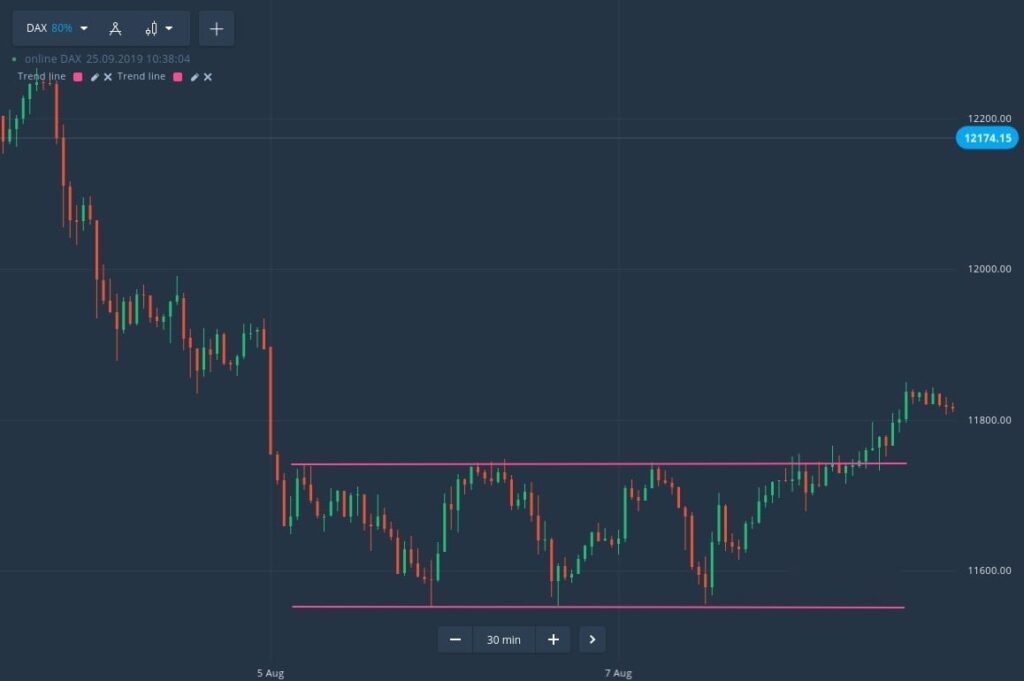
Let's talk about the range market for a second. Prices rise to a certain level before dropping to a different level. A higher price produces a level of resistance, whereas a lower price gives support. They are so strong that once the price reaches them, it simply bounces back without breaking out of the resistance or support.

Lines that are parallel to one other are used to produce support and resistance. At least two bottoms will be joined to form the support line. At least two tops will be connected by the resistance line. Take a look at the DAX chart below for the last 30 minutes.
How do I spot a rectangular price pattern?

When a trend is coming to a conclusion, the rectangular pattern is visible. It denotes a shift in the trend's direction.

As a result, the best time to look for price consolidation is at the top or bottom of an upward or downward trend. And what it means is that the directed movement is over and the trend is about to turn around. Prices do not exceed or fall below a specified level at this time.

When the rectangle pricing pattern appears, what should you do?

Once the pricing boxes pattern has developed, it is usually straightforward to spot. But don't be concerned. You may still be able to profit from it before the new trend starts.

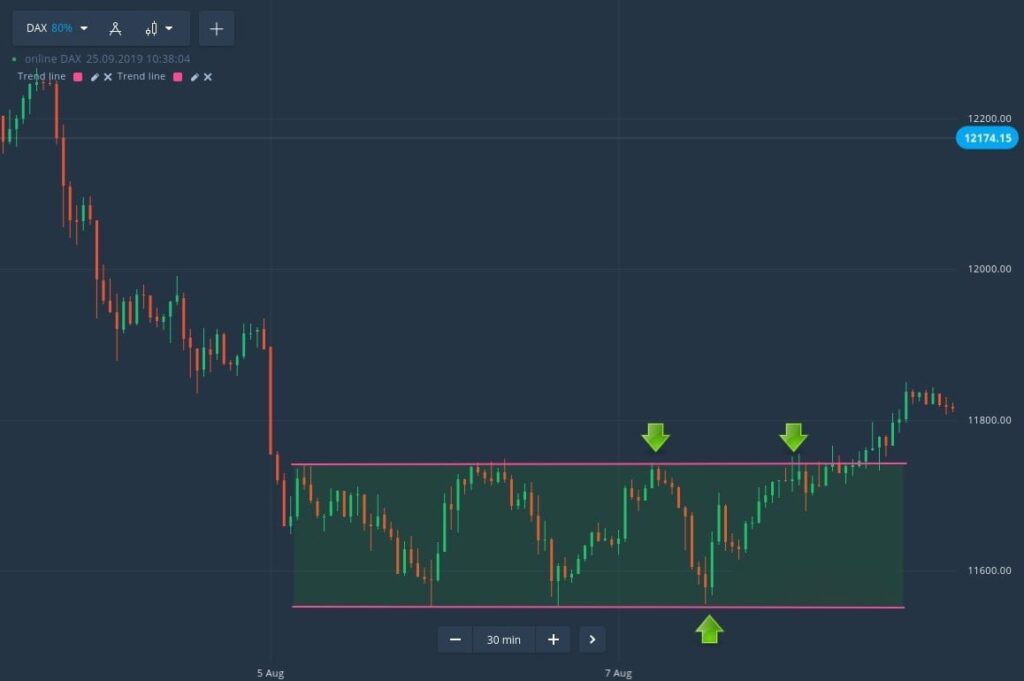
Drawing the support/resistance lines should be your initial step. Then keep an eye out for when the price crosses the lines. You should open a buy position when the support line is reached. Open a sell position if the resistance line is touched.

When trading short-term deals, we recommend using the large time frame chart. If you're trading on a 30-minute chart, for example, open 5-minute trades. As a result, you may be confident that the price will remain within the rectangle and will not rebound before the trade expires.
When the rectangle pricing pattern appears, what should you do?

What to do when the price breaks out of the support or resistance level

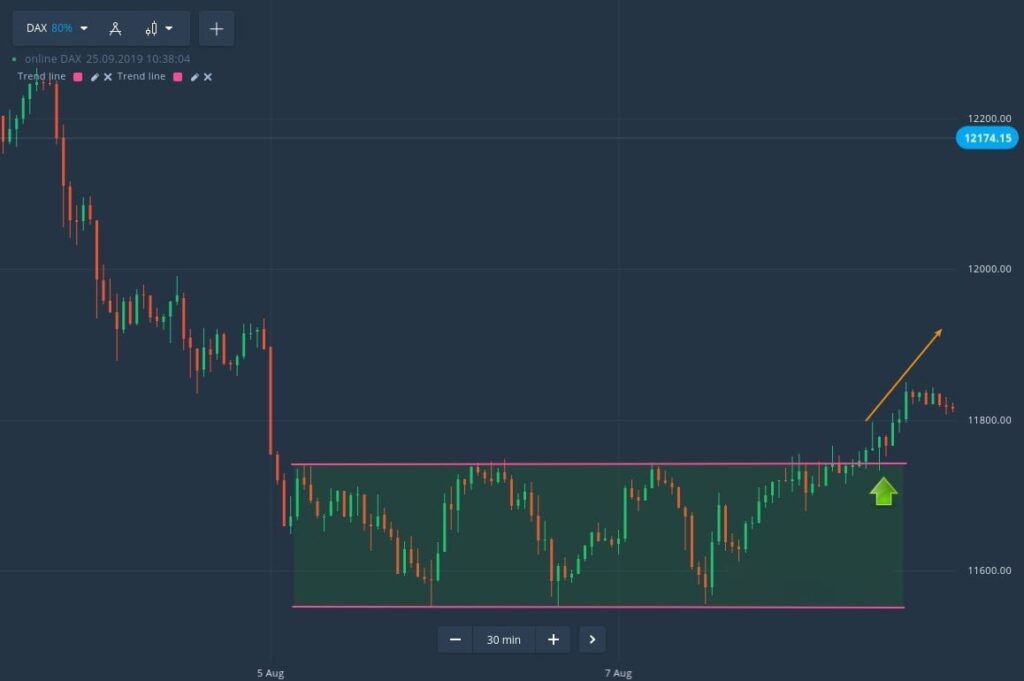
You must be ready for the price to break through the support or resistance level. Sooner or later, it will happen. After the breakthrough, keep an eye on the direction the price is heading and trade accordingly.

As the uptrend develops, you should enter a buy position if the price breaks the resistance level, as seen in our example chart below.
What to do when the price breaks out of the support or resistance level

Conclusion

The price boxes pattern lasts for a while, and during that time the price fluctuates within a set range. Finally, when the price momentum is really strong, the barrier is broken. There are certain signs that this is about to happen. For instance, the candles are longer and of the same color. As a result, you have every reason to believe the market will continue to move in the breakout direction.

Taking into account all of the foregoing, you might enter the market in response to a changing trend.

https://keithrainz.me/how-to-use-the-rectangular-price-boxes-strategy/?feed_id=1260&_unique_id=64f6da3a8d652

Comments

Popular posts from this blog

Elliot Wave Theory Explained and how to use it

Ralph Elliott was a theorist and a professional accountant. In the 1930s, he identified the fundamental social concepts and developed analytical methods. He suggested that market prices follow precise patterns, which are now known as Elliott waves, or simply waves. What is Elliott Wave Theory? Elliott proposed that financial price movements were the outcome of investors' primary psychology. He discovered that changes in public opinion always manifested themselves in the same periodic "waves" in financial markets. The Elliott and Dow theories are similar in that they both acknowledge that stock values move in waves. Elliott, on the other hand, was able to dissect and study markets in far greater depth. Elliot began to investigate how these recurring patterns could be used to forecast future market movements. We know in the financial markets that "what goes up, must come down," because a price movement up or down is always followed by a price mo...

Kaza Spike Detector

The Kaza Spike Detector is the best Spike detector for Boom 1000 and Crash 1000 so far. You can download it for free from the link below. But before you download, please watch the video on how to install it. Features of the Kaza Spike detector: The Kaza spike detector has 9 indicators and 1 template. Please watch the video to know how to import and apply the indicators and templates. Download Kaza spike detector You can download the Kaza spike detector below. To keep on receiving free indicators, systems and other forex files, consider joining my email list , Telegram channel and subscribing to my YouTube channel. Kaza download link Here is the direct download link. Click here to download Watch the video below to learn how to install Kaza spike detector https://www.youtube.com/watch?v=12cdcVOd4QA https://keithrainz.me/kaza-spike-detector-2/?feed_id=433&_unique_id=64bd2cbbadacf

Triangle Pattern strategies - How to trade triangle pattern strategies

Triangles are technical analysis tools that belong to continuation patterns. This pattern frequently develops in response to a trend. For this, you need to draw them on the chart to easily identify them. You must first identify at least two highs and two lows along the trend to draw a triangle pattern. A straight line should be drawn between the two highs and the two lows and then extend the two lines together until they form a triangle. You'll learn more about the three different triangles in this guide. I'll also show you how to put them to use in your binary options trading or forex trading. Triangle patterns you must know Triangle patterns are divided into three categories: ascending triangles, descending triangles, and symmetrical triangles. As previously stated, each triangle must have at least two highs and two lows connected by two lines intersecting at the apex. Let's take a closer look at each of the three triangle patterns. The symmetri...